
After falling to 6.4% in Q1 2009 the yearly growth rate of China’s real GDP climbed to 12.2% by Q1 2010. Afterwards the yearly growth rate has been on a declining trend closing at 6.9% in Q2 this year.
It is an open secret that the relatively high GDP growth rates reflect an aggressive building activity of “ghost cities”. Unlike the US, where cities often begin as small developments and grow in accordance to the local industries requirements, Chinese cities were built to the point of near completion before introducing people.
Various estimates indicate that there could be between 20 to 50 “ghost cities” in China. Given the fact that local authorities are compelled to contribute to economic activity in line with the central planning, they are building aggressively regardless of whether it is economically justifiable. Hence, strong GDP data not always correlate with individual’s improvement in living standards.
Regardless of the economic system employed, whether it is centrally planned or more market related system, every economic activity that is set in motion must be funded.

The key for this is the pool of real savings. If the existent infrastructure generates fewer resources than it is absorbing them, this puts pressure on the pool of real savings thereby slowing down the ability to grow the economy.
As a rule at this stage, the central bank steps in to “alleviate” the pressure on the pool of savings. Obviously, this cannot be done – the central bank cannot create real savings – all it can do is to print money, which masquerades as real savings and undermines the pool of real savings.
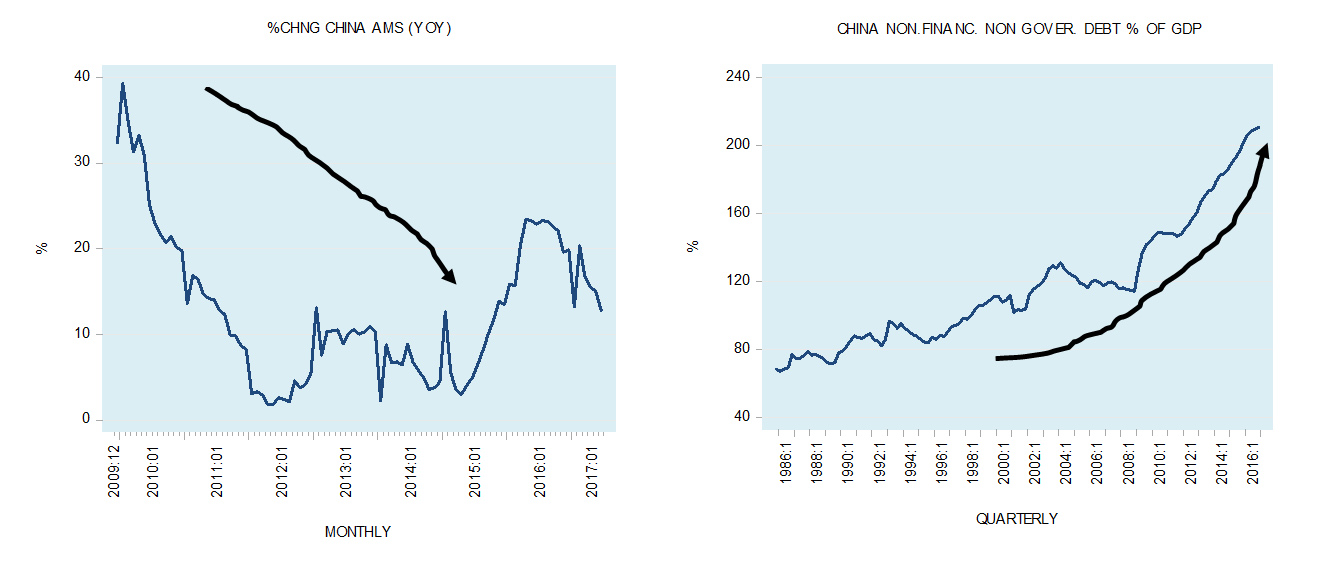
Note that the yearly growth rate of China’s money supply, which stood at 5% in January 2009 jumped to 39.3% by January 2010. This massive increase coupled with previous strong increases in the money supply growth rate has provided strong support for various bubble activities including the building of “ghost cities”.
Since January 2010, the yearly growth rate of money supply has followed a steep downtrend plunging to 1.8% by May 2012. Observe that after May 2012 to May 2015 the growth rate followed sideways direction.
Hence, we can conclude that since January 2010 to May 2015 the money supply growth rate followed a downtrend. In addition, during this period China’s private sector debt as percentage of GDP seems to follow an uptrend, closing at 210.6% in Q4 last year.
We suggest that the long-term downtrend in the money supply growth rate may undermine severely economic activity and the stock market in the months to come. Observe that once money is injected into the economy it does not enter all the markets instantly but moves from market to market. Once the first round completed the same monetary impulse starts another round etc. Hence, the overall time lag could be quite long.
Because of this, the effect of the previous monetary injections could dominate the economic scene over prolonged time. On this, we have estimated that the overall long-term changes in money supply and its effect on manufacturing activity and the Shanghai SE stock price index could be as long as 86 months.

Factoring in the long-term effects, the implications are not good. Manufacturing activity in terms of the PMI could come under severe pressure in the months to come. We have also estimated that the Shanghai SE stock price index, which closed at 3,273 in July, could fall to 2,304 by December – a fall of almost 30%. By December next year, the index could fall to 1,677 before closing at 1000 by December 2019. Note that this analysis is from the monetary perspective.

