
Super-cycle theory
In a 2012 paper for the United Nations/DESA – Super-cycles of commodity prices since the mid-nineteenth century – Bilge Erten and José Antonio Ocampo review the literature on the theory of Commodity Super-Cycles and go on to suggest that the current cycle began in 1999. Here is an extract from their concluding remarks:-
The decomposition of real commodity prices based on the BP filtering technique provides evidence of four past super-cycles ranging between 30 to 40 years. For the total real non-fuel commodities, these cycles have occurred (1) from 1894 to 1932, peaking in 1917, (2) from 1932 to 1971, peaking in 1951, (3) from 1971 to 1999, peaking in 1973, and (4) the post-2000 episode that is still ongoing. These long cycles, which possess large amplitudes varying between 20 to 40 percent higher or lower than the long-run trend, are also a characteristic of sub-indices. Among the agricultural indices, the tropical agriculture exhibits super-cycles with much larger amplitude relative to non-tropical agriculture. The amplitudes of super-cycle components of real metal and crude oil prices are comparable to those of agricultural products in earlier parts of the twentieth century, but they become much more pronounced and strong in the latter parts of the century. The presence of co-movement among non-fuel commodity indices is supported by the correlation analysis across the entire sample, and a marked co-movement between oil and non-oil indices is present for the second half of the twentieth century.
Another important finding of the paper is that, for non-oil commodities, the mean of each supercycle has a tendency to be lower than that of the previous cycle, suggesting a step-wise deterioration over the entire period in support of the Prebisch-Singer hypothesis*. This finding applies especially to tropical and non-tropical agricultural prices, as well as metals in previous cycles. An exception to this rule is that of metals during the current super-cycle, when the mean last cycle is higher than the preceding one; however, the contraction phase of this cycle has not even began yet, which can lower the mean of the whole cycle in the upcoming years. Another way of capturing these trends is through long-term trends, with tropical agricultural prices experiencing a long severe long-term downward trend through most of the twentieth century, followed by non-tropical agriculture and metals. The duration of the long-term downward trends across all non-fuel commodity groups is on average 100 years. The magnitude of cumulative decline during the downward trend is 47 percent for the non-fuel commodity prices, with recent increases of around 8 percent far from compensating for this long-term cumulative deterioration. In contrast to these trends in non-oil commodity prices, real oil prices have experienced a long-term upward trend, which was only interrupted temporarily during some four decades of the twentieth century.
The recent commodity price hike of the early twenty-first century has commonly been attributed to the strong global growth performance by the BRIC economies, and particularly China, which is particularly metal- and energy-intensive. Based on the VECM results, it is found that super-cycles in the world output level are a good predictor of the super-cycles in real non-fuel commodity prices, both for the total index and sub-indices. This finding confirms that the global output accelerations play a major role in driving the commodity price hikes over the medium run. Therefore, the ongoing commodity price boom could last only if China and other major developing countries are capable of delinking from the long period of slow growth expected in the developed countries.
* Prebisch-Singer hypothesis – suggests that over the long run the price of primary goods such as commodities declines in proportion to manufactured goods.
What is clear from this research is that commodities are far from homogeneous. A strong trend in industrial metals may not coincide with a strong trend in tropical soft commodities or North American grains. Nonetheless, the idea of the super-cycle is beguiling, because it ties the demand for all commodities to economic growth. The Russian economist Nikolai Kondratiev (1892-1938) developed a theory of Long Waves in the early 1920’s. He discarded exogenous factors, such as wars and revolutions, in favour of endogenous drivers, like technological advances and capital accumulation. The Austrian economist Joseph Schumpeter took these ideas further, developing his theory of ‘Creative Destruction’.
From Theory to Practice
Enough of the theory, where are we now? To answer this I will start with one of my favourite charts, one which regular readers have seen before:-
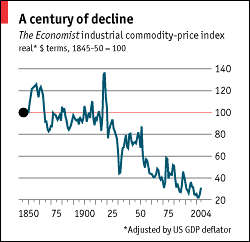
Source: Economist
This chart shows commodity prices between 1850 and 2005, adjusted for inflation. Schumpeter’s theory of Creative Destruction looks compelling; periods of high commodity prices spur innovation which leads to a lowering of prices in response to productivity gains.
Since 2008 the Bloomberg Commodity Index has weakened:-
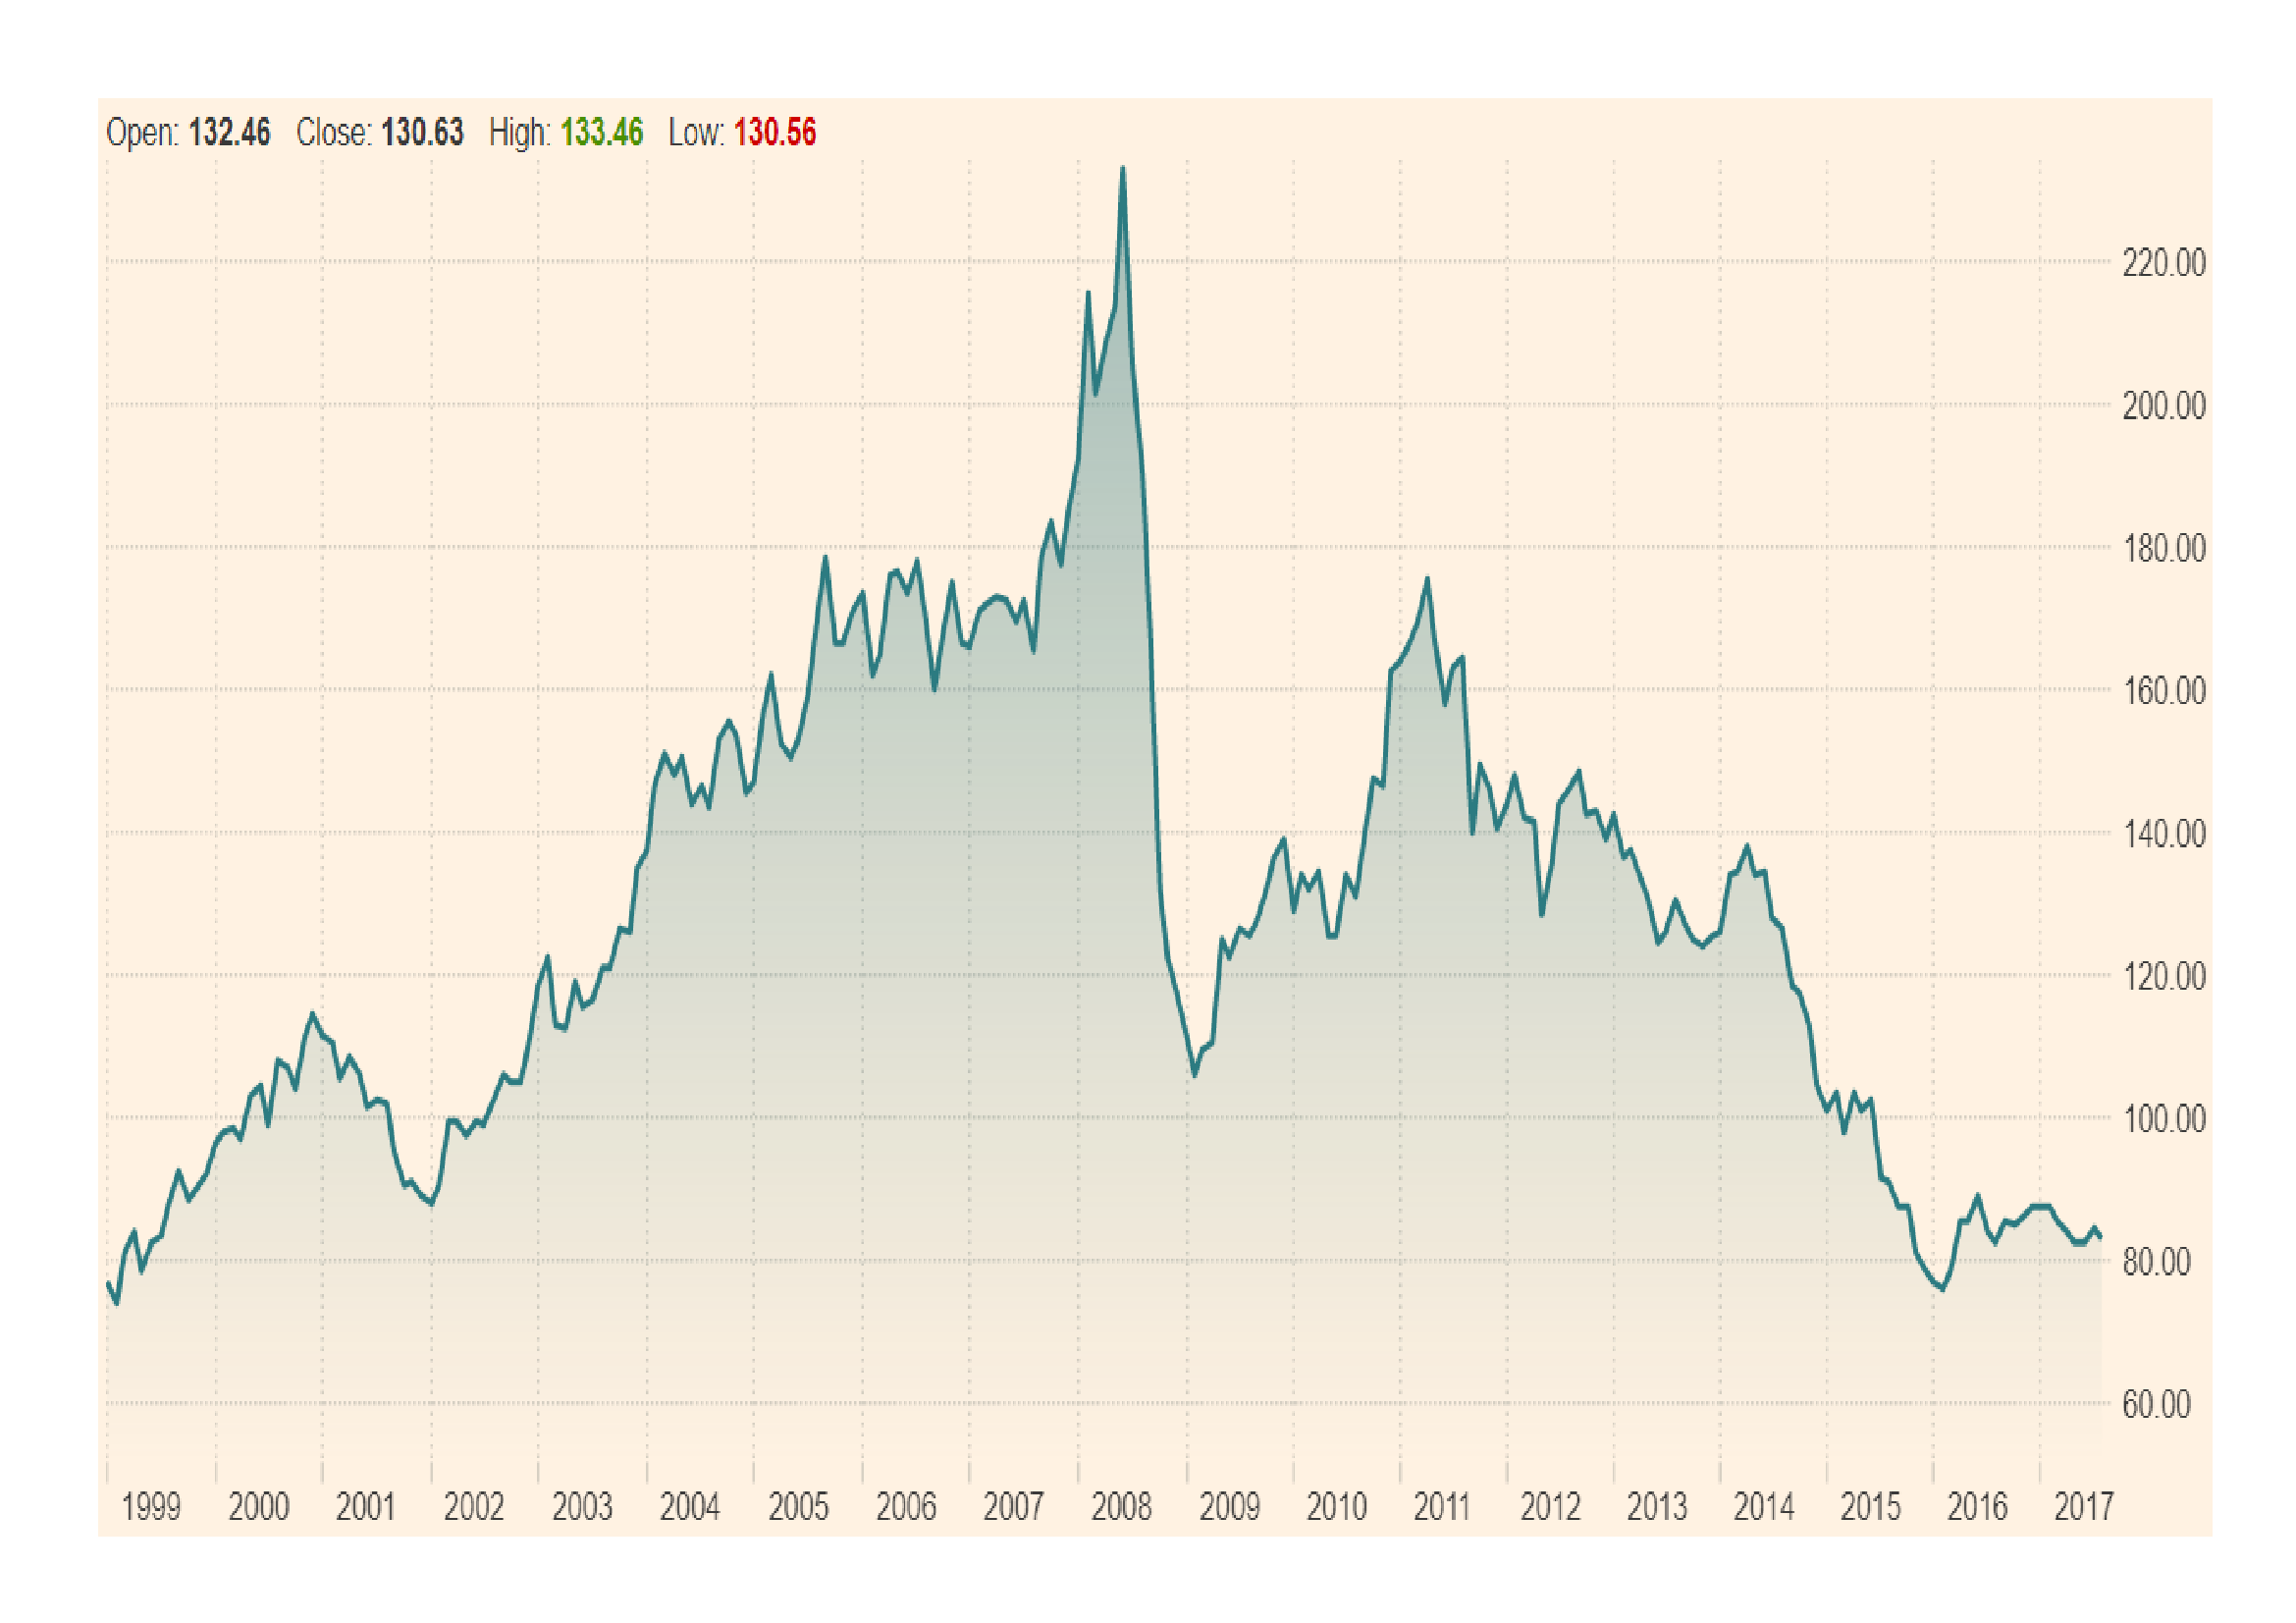
Source: Bloomberg, Financial Times
The above chart – which is not inflation adjusted – shows the current commodity super-cycle since January 1999. The meteoric rise, the impact of the Great Recession of 2008-2009, the subsequent rebound, as QE kicked-in, and the continuation of the downward trend, marking a complete retracement of the upward move from 1999 to 2008, are all clearly evident. Now a number of commodities have begun to rise simultaneously.
Has the period of creative destruction run its course and permanently reduced supply? Or is the current rebound merely a shorter-term correction which, through higher prices, will encourage new capital investment in productivity enhancing techniques which will rapidly lower those prices once more – 17 years, after all, would make this the shortest super-cycle to date? To answer these questions we need to consider the state of the world economy, especially the growth potential of emerging and developing countries.
The Global Economy and Commodity Demand
Global economic growth has been muted during the past decade. The chart below shows World GDP growth from 1999 to 2015:-
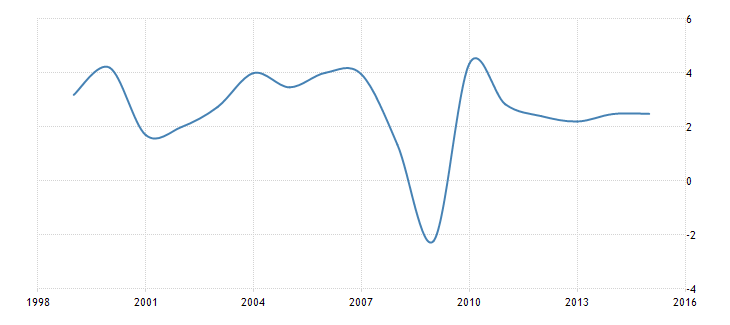
Source: Trading Economics, World Bank
Recent data – and forecasts – from the IMF, suggest that drivers of global growth are changing. Here is an extract from the IMF WEO for July:-
The pickup in global growth anticipated in the April World Economic Outlook remains on track, with global output projected to grow by 3.5 percent in 2017 and 3.6 percent in 2018. The unchanged global growth projections mask somewhat different contributions at the country level. U.S. growth projections are lower than in April, primarily reflecting the assumption that fiscal policy will be less expansionary going forward than previously anticipated. Growth has been revised up for Japan and especially the euro area, where positive surprises to activity in late 2016 and early 2017 point to solid momentum. China’s growth projections have also been revised up, reflecting a strong first quarter of 2017 and expectations of continued fiscal support. Inflation in advanced economies remains subdued and generally below targets; it has also been declining in several emerging economies, such as Brazil, India, and Russia.
The IMF goes on to opine that, despite the stable outlook for 2017/2018, global growth remains below pre-crisis levels for the majority of advanced economies and, more importantly, for commodity-exporting emerging and developing countries. These tentative conditions seem unlikely to favour the beginning of a sustained upswing in commodity prices, nonetheless, prices, especially for industrial metals, have shown impulsive strength. The chart below compares the Bloomberg Commodity sub-indices over the past year, industrial metals appear to be the only game in town:-
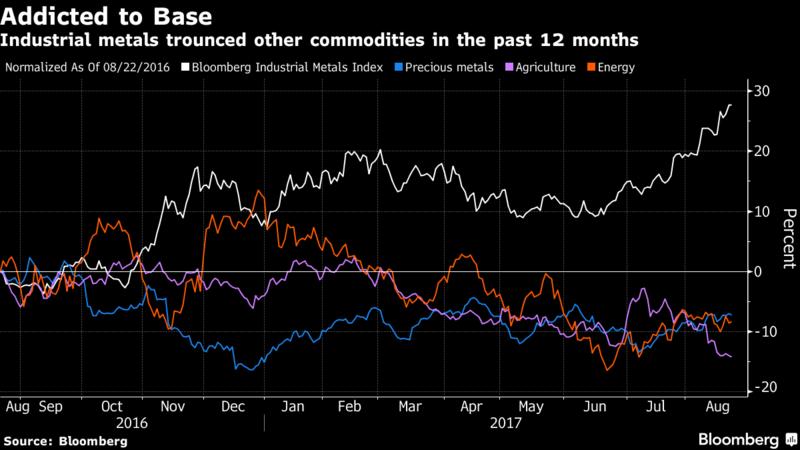
Source: Bloomberg
Even these sub-indices mask some individual trends. Palladium, a constituent of the precious metals index, made a 16 year high at $945/oz. on 29th August – up 122% from its January 2016 low. Lesser known PGMs, Ruthenium and Rhodium are both up more than 60% in the nine months to May 2017. Copper, the bellwether of industrial metals tested $3.08/lb, its highest since October 2014. LME 3 month Aluminium traded $2,121.75/ton, the highest since February 2013 and 3 month Zinc traded $3,179.50/ton, its highest level for a decade.
Mining companies have rallied in the wake of these higher prices. Market commentators argue that a combination of tight supply and increased demand, especially from China – whose growth forecast was revised from 6.2% to 6.7% by the IMF last month – are the principal near-term factors behind the rally. Additional factors include the relative weakness of the US$ and a, widely anticipated, more hawkish, central bank stance on interest rates.
A fascinating analysis on the relationship between Chinese growth and commodity prices is contained in this article from Jodie Gunzberg of S&P – Chinese Demand Growth Lifts Every Commodity:-
Overall the S&P GSCI only moves in the same direction as Chinese GDP growth changes in about 57% or 26 of 46 years. However, when the Chinese GDP growth is split into rising and falling periods, commodity returns seem to be more influenced by rising growth than slowing growth. Of the 46 years, growth rose 19 times with 15 or 79% positive annual commodity returns. The slowing growth years were much less influential, driving down commodity performance in only 11 of 27 years, or in 41% of time. Though, big negative years like in 1976, 1981, 1986, 2008, and times with consecutive years of falling growth like in 1997-98, 2013-15 seemed to bring commodities down.
Ms Gunzberg goes on to look at the breakdown by sub-sector, finding that only Livestock and Agricultural commodities which fall in response to a decline in Chinese GDP growth. The table below, which drills down to the behaviour of individual commodities, is particularly instructive:-

Source: S&P Dow Jones Indices
Some industrial metals, such as Lithium – used in the manufacture of lightweight car batteries – have seen a dramatic increase in underlying demand. It has risen from a low of $62/ton in February 2016 to $122/ton this week. However, an entire range of other industrial metals has also witnessed rising prices over the past 12 months:-

Source: Trading Economics, Infomine
In an attempt to answer my initial question I quote from PWC – Mine 2017 – Stop, Think…Act–
Stop
In 2016, traditional players continued balance sheet bolstering to calm the market and stop the angst associated with financial distress. A heavy emphasis was placed on shedding debt. The brakes were firmly applied to exploration activities which continued to shrink, and what little was undertaken was generally allocated to “safe” jurisdictions. Capex fell dramatically again, by a further 41 percent, to a new record low of just $50 billion, and there was a lack of significant greenfield projects announced or commenced. Production was generally flat. While the Top 40 faced external headwinds in the form of increased oil prices, prudent cost control measures ensured operating expenditure was constrained. Traditional miners were rewarded with a strong upswing in their market cap, and earned some breathing space. Many planned disposals were called off in response to better market conditions. The exception to this was the 11 Chinese companies within the Top 40. China defied conventional industry behaviour and invested at the bottom of the cycle. Indeed, the most significant asset buyers among the Top 40 were Chinese companies.
Think
In the short term, shareholders may appreciate the strengthening of balance sheets and increases in share prices. But the industry will need to execute a longer term vision or it will remain at the mercy of commodities speculators. Shareholders will demand performance from the existing asset base, culminating in dividends, or they will simply reallocate their capital if the mining sector cannot provide a long-term growth vision. There is clearly a divergence in thinking between Chinese companies and the rest of the Top 40 as their goals are different and Chinese capital is more patient. China aside, the old guard have donned hard hats, high viz jackets and steel-capped boots in a bid to protect themselves from the pitfalls of the recent past. Praise should be given for the efforts to repay debt, innovate and adopt new efficiency measures – all of which have helped to curb costs and restore credit ratings and investor trust. But where will this thinking take the industry if a “playing it safe” attitude to investment prevails in the future? We argue that it will lead back to old habits of lavish spending in a boom followed by a wave of write-offs during the bust that inevitably follows.
Act
Balance sheet clean-ups require discipline and much hard work has been done. We witnessed the tailing-off of impairments, the avoidance of any new bankruptcies, the absence of any significant streaming transactions and the general passing of distress. The market rightly applauded this, reinstating a positive gap between market caps and net book values that was absent in 2015. Healthier price-to-earnings (P/E) multiples returned. And, even as price growth slowed early this year, valuations continued to rise until April. This provides a platform for the industry to act into the future. What we failed to see was significant action on the future direction of the Top 40, at least by the traditional players. We’ve called the industry out in the past for reacting to short-term price movements, and thankfully this did not happen in 2016. Is the pause an indication of longer term thinking by the industry? One major (Rio Tinto) may think so. Recognising the long-term, cyclical nature of the industry, it has publicly stated that its new CEO has a “10-year mandate…Emerging market companies, who are also focused on new world minerals, are increasingly integrated. In the traditional markets, we are seeing new players seeking to secure supply and even calls by stakeholders for BHP to get on board the battery train. It remains to be seen if a major will pivot in this direction. What will be the results of this reflection for the remainder of 2017? Will action come in the form of investment in greenfield projects, M&A or technology? The latter, we think, simply cannot be ignored. Aside from the completion of new projects, none of the majors has signalled bold intentions for future growth. But who could blame them when early 2017 has heralded further volatility in prices and the subsequent reversal of some of the 2016 gains. Few things are certain in this industry, but we know that China is unwavering in its strategy, shareholder activism is rising, government interventions are becoming more commonplace and new players are disruptive. Will the industry also act, or simply react?
Conclusion and Investment Opportunities
It is too early to predict the beginning of a new up-trend in the next commodity super-cycle, however, mining companies, outside of China, have reduced capital expenditure over the last few years and, given the long lead times in the mining industry, the current uptrend in prices is probably a function of supply constraints, emanating from a lack of investment, combined with a marginal increase in global demand. I believe, however, that this trend can continue for some while. Inflation in the US and Europe remains subdued, deflation remains a near and present danger in Japan; therefore the major Central Banks are likely to maintain a low interest rate regime. The current long economic expansion will continue for a while yet.
During the last major uptrend in commodity prices, China was the main source of additional demand. Since announcing their 12th Five Year Plan in March 2011, China has adopted a policy of ‘Rebalancing’ towards domestic demand, away from mercantilist export oriented growth. Under this new regime, the services sector should expand faster than manufacturing and demand for raw materials, such as industrial commodities, should decline structurally. July saw the publication of a new paper from the IMF – Financial Development Resource Curse in Resource-Rich Countries: The Role of Commodity Price Shocks – it develops some of the ideas contained in the Prebisch-Singer hypothesis. I suspect the Chinese authorities have known the advantage of diversifying their economy away from basic materials from many years. Barring a significant increase in demand from other emerging and developing economies, such as India, the current up-trend in industrial metals is likely to be relatively short-lived, another year to 18 months should see new capital expenditure deliver increased supply. Prices will diminish.
Individual industrial commodities, such as Cobalt and Lithium, will see higher prices, even from their current elevated levels, due to structural demand increases. Other industrial commodities will be more likely to revert to mean as new supply meets global demand over the next couple of years.
