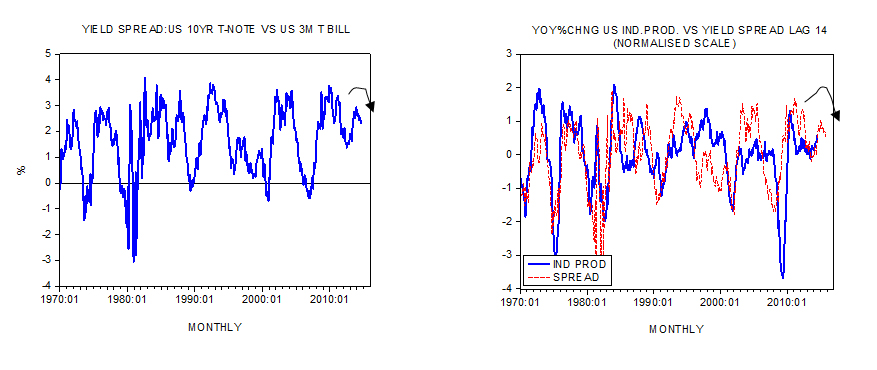
So far in August the differential between the yield on the 10-year Treasury note and the yield on the 3-month Treasury bill stood at 2.38% against 2.95% in December 2013.
Historically the yield differential on average has led the yearly rate of growth of industrial production by fourteen months. This raises the likelihood that the growth momentum of industrial production will ease in the months ahead, all other things being equal.
It is generally held that the shape of the yield curve is set by investors’ expectations. According to this way of thinking – also labeled as the expectation theory (ET) – the key to the shape of the yield curve is the notion that long-term interest rates are the average of expected future short-term rates.
If today’s one-year rate is 4% and next year’s one-year rate is expected to be 5%, the two-year rate today should be (4%+5%)/2 = 4.5%.
It follows that expectations for increases in short-term rates will make the yield curve upward sloping, since long-term rates will be higher than short-term rates.
Conversely, expectations for a decline in short-term rates will result in a downward sloping yield curve. If today’s one-year rate is 5% and next year’s one – year rate is expected to be 4%, the two-year rate today (4%+5%)/2 = 4.5% is lower than today’s one year rate of 5% – i.e. downward sloping yield curve.
But is it possible to have a sustained downward sloping yield curve on account of expectations? One can show that in a risk-free environment, neither an upward nor a downward sloping yield curve can be sustainable.
An upward sloping curve would provoke an arbitrage movement from short maturities to long maturities. This will lift short-term interest rates and lower long-term interest rates, i.e., leading towards a uniform interest rate throughout the term structure.
Arbitrage will also prevent the sustainability of an inverted yield curve by shifting funds from long maturities to short maturities thereby flattening the curve.
It must be appreciated that in a free unhampered market economy the tendency towards the uniformity of rates will only take place on a risk-adjusted basis. Consequently, a yield curve that includes the risk factor is likely to have a gentle positive slope.
It is difficult to envisage a downward sloping curve in a free unhampered market economy – since this would imply that investors are assigning a higher risk to short-term maturities than long-term maturities, which doesn’t make sense.
The Fed and the shape of the yield curve
Even if one were to accept the rationale of the ET for the changes in the shape of the yield curve, these changes are likely to be of a very short duration on account of arbitrage. Individuals will always try to make money regardless of the state of the economy.
Yet historically either an upward sloping or a downward sloping yield curve has held for quite prolonged periods of time.
We suggest an upward or a downward sloping yield curve develops on account of the Fed’s interest rate policies (there is an inverse correlation between the yield curve and the fed funds rate).
While the Fed can exercise a certain level of control over short-term interest rates via the federal funds rate, it has less control over long-term interest rates.

For instance, the artificial lowering of short-term interest rates gives rise to an upward sloping yield curve. To prevent the flattening of the curve the Fed must persist with the easy interest rate stance. Should the Fed slow down on its monetary pumping the shape of the yield curve will tend to flatten. Whenever the Fed tightens its interest rate stance this leads to the flattening or an inversion of the yield curve. In order to sustain the new shape of the curve the Fed must maintain its tighter stance. Should the Fed abandon the tighter stance the tendency for rates equalisation will arrest the narrowing or the inversion in the yield curve.
The shape of the yield curve reflects the monetary stance of the Fed. Investors’ expectations can only reinforce the shape of the curve. For instance, relentless monetary expansion that keeps the upward slope of the curve intact ultimately fuels inflationary expectations, which tend to push long-term rates higher thereby reinforcing the positive slope of the yield curve.
Conversely, an emerging recession on account of a tighter stance lowers inflationary expectations and reinforces the inverted yield curve.
A loose Fed monetary policy i.e. a positive sloping curve, sets in motion a false economic boom – it gives rise to various false activities. A tighter monetary policy, which manifests through an inversion of the yield curve, sets in motion the process of the liquidation of false activities i.e. an economic bust is ensued.
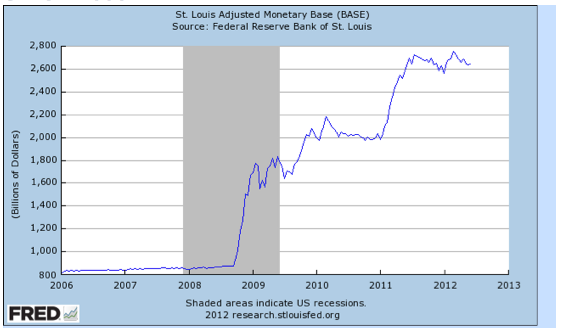
A situation could emerge however where the federal funds rate is around zero, as it is now, and then the shape of the yield curve will vary in response to the fluctuations in the long-term rate. (The fed funds rate has been around zero since December 2008).
Once the Fed keeps the fed funds rate at close to zero level over a prolonged period of time it sets in motion a severe misallocation of resources – a severe consumption of capital.
An emergence of subdued economic activity puts downward pressure on long-term rates. On the basis of a near zero fed funds rate this starts to invert the shape of the yield curve.
At present, we hold the downward slopping yield curve has emerged on account of a decline in long term rates whilst short-term interest rate policy remains intact.
We suggest this may be indicative of a severe weakening in the wealth generation process and points to stagnant economic growth ahead.
Note again the downward sloping curve is on account of the Fed’s near zero interest rate policy that has weakened the process of wealth formation.