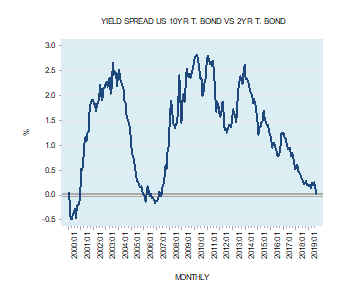
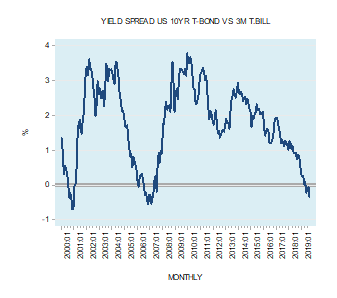
On Wednesday August 14 2019, participants in financial markets were shocked by the news that the differential between the yield on the 10-year Treasury bond (T-bond) and the 2-year Treasury bond briefly became negative. A decline in the yield on long-term debt versus short-term debt is labeled as the yield inversion. A yield spread between the 10-year T-bond and the 3-month T-bill rate shows even more pronounced inversion (see chart). For most financial commentators the yield inversion signals difficult times ahead as far as economic conditions are concerned.
|
|
|
We suggest that the inversion of the yield curve that worried participants in financial markets is actually old news regarding the possibility of an economic slump ahead. What matters here is the shape of the yield curve over time. Whenever the difference i.e. the yield spread begins to follow a declining trend this could be a signal for a future economic downturn. Conversely, whenever the yield spread starts to follow an uptrend this could be a signal for future economic upturn.
Historically, we can be observe that most economic slowdowns in the US were preceded by significant declines in the yield differential between the 10-year T-bond and the 3-month Treasury security. Typically, this narrowing in the yield spread occurs many months before the onset of the slower economic growth.
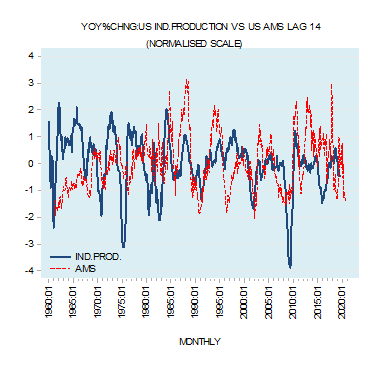
We have estimated that on average the yield spread leads the annual growth of industrial production by 14 months. Based on this the lagged yield spread peaked in August 2018.
This could then mean that the signal for a possible economic slowdown already emerged on August 2018 and not on Wednesday August 14 2019.
We also suggest that it is central bank policies which are aimed at exercising control over the short-term interest rate, such as the federal funds rate in the US, that set the shape of the yield curve.
|
|
How the Fed’s tampering generates an upward or downward sloping yield curve
While the Fed can exercise control over short-term interest rates via the federal funds rate, it has less control over longer-term rates. In this sense, long-term rates can be seen as reflecting, to a greater degree, the underlying time preferences of individuals.
The Fed’s policies that are aiming at exercising a control over short-term interest rates are a key cause behind the deviation of short-term rates from the relatively less-manipulated long-term rate.
When the Fed lowers the policy interest rate target this almost instantly lowers short-term interest rates, whilst to a lesser degree affecting longer-term rates. As a result, an upward sloping yield curve develops. (The interest rate differential between the long-term rate and the short-term rate widens). Conversely, when the Fed reverses its stance and lifts the policy interest rate target this lifts short-term interest rates. As a result, a downward sloping yield curve emerges.
As a rule Fed policy makers decide about their interest rate stance in accordance with the observed and expected state of the economy and price inflation. Whenever the economy starts to show signs of weakening and the rate of increase of various price indexes begins to soften, investors in the market start to form expectations that in the months ahead the Fed is going to lower its policy interest rate.
As a result, short-term interest rates start to move lower. The spread between the long-term rates and the short-term rates widens – the process of the development of an upward sloping yield curve is set in motion. However this process cannot be sustained unless the Fed actually lowers the policy interest rate. Once the Fed has lowered the policy rate the widening in the yield spread gets consolidated.
Conversely, whenever economic activity shows signs of strengthening, coupled with a rise in price inflation, investors’ in the market start to form expectations that in the months ahead the Fed is going to lift its policy interest rate.
As a result short term interest rates begin to move higher. The spread between long-term rates and short-term rates narrows – the process of the development of a downward sloping yield curve is set in motion. Also this process cannot be sustained without the Fed’s actually raising the policy interest rate. Once the Fed raises the policy interest rate, the narrowing in the yield spread consolidates. Note again that without the Fed’s intervention neither the upward nor the downward yield curve is going to be sustainable.
In his writings, Murray Rothbard argued that in a free market economy an upward sloping yield curve could not be sustained because it would set in place an arbitrage between short and long-term securities. Investors will shift funds from short maturities to long maturities.
This would lift short-term interest rates and lower long-term interest rates, resulting in the tendency towards a uniform interest rate throughout the term structure. (A flattening in the yield curve emerges after adjusting for risk).
Arbitrage will also prevent the sustainability of a downward sloping yield curve by shifting funds from long maturities to short maturities and thereby, after allowing for risk, flattening the curve.[1]
On this way of thinking without the Fed’s manipulating the short-term interest rate the shape of the yield curve, after allowing for risk, is going to be neither upward nor downward slopping.
Why do changes in the shape of the yield curve precede economic activity?
Whenever the central bank reverses its monetary stance and alters the shape of the yield curve it sets in motion either an economic boom or an economic bust. However these booms and slumps arise with time lags – they are not immediate. The impact of a change in monetary policy works with a time lag.
It is the lagged effect of a change in monetary policy that makes the change in the shape of the yield curve a good predictive tool. For instance, during an economic expansion, the central bank raises its interest rates and flattens the yield curve, the effect is minimal as economic activity is still dominated by the prior loose monetary stance. It is only later on, once the tighter stance begins to dominate the scene that economic activity begins to weaken.
Yield spread and the AMS annual growth rate
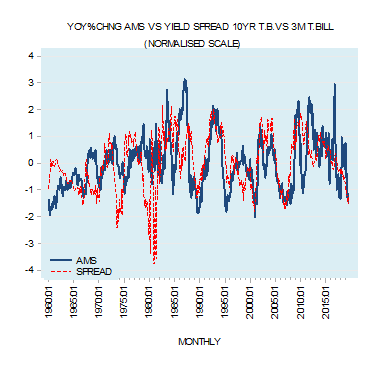
Note that fluctuations in the yield spread are closely associated with fluctuations in the annual growth rate of AMS (see chart).
|
|
An upward slopping yield curve as a result of the lowering of short-term interest rates by the Fed is associated with a strengthening in the generation of money out of “thin air” and in the strengthening in the momentum of AMS.
A downward slopping yield curve due to a tighter interest rate stance of the Fed is associated with a weakening in the pace of generation of money out of “thin air” and hence with a decline in the annual growth rate of AMS.
This of course means that fluctuations in the momentum of AMS that corresponds to the relevant yield spread provides signals regarding future fluctuations in economic activity.
Based on the current downward slopping yield curve and the consequent downward momentum of AMS we can suggest that the annual growth rate of economic activity in terms of industrial production is likely to come under downward pressure in the months ahead (see chart).
|
|
Conclusions
We believe it is the peak in the differential between the yield on the 10-year T-bond and the 3-month Treasury bill rate in August 2018 that signaled the beginning of the likely economic slowdown in the US and not the negative differential that emerged on Wednesday August 14th this year. The inversion of the yield curve on August 14th is old news regarding the future direction of the US economy.
Furthermore the shape of the differential or the shape of the yield curve is formed in response to Fed’s policy makers setting targets to the federal funds rate. A change in the target results in the subsequent change in the shape of the yield curve. This in turn is mirrored by changes in the growth momentum of money supply out of “thin air”, which is responsible after a time lag for the boom-bust cycles.
Note that the shape of the yield curve is just an indicator as it were it does not have causative powers as such -it is changes in the momentum of money supply in response to changes in Fed’s interest rate policy that sets the menace of boom-bust cycles.
Changes in the growth rate of money supply correspond to a given shape of the yield curve. An upward slopping yield curve corresponds to a rising momentum of the money supply. The downward slopping yield curve corresponds to the declining annual growth rate of money supply. Based on this we hold that a visible downtrend in the lagged interest rate differential since August 2018 does not bode well for economic activity in the months ahead.
We also suggest that in a free market without the existence of a central bank, after adjusting for risk, the shape of the yield curve is going to be neither upward not downward slopping but rather flat.
[1] Murray Rothbard Man, Economy, and State Nash Publishing p 384


