Neither a borrower nor a lender be;
For loan oft loses both itself and friend,
And borrowing dulls the edge of husbandry.
Hamlet I, iii – Shakespeare
- BIS research indicates that household debt to GDP ratios above 80% reduce growth
- But higher household savings do not appear to lead to higher investment
- Counter-cyclical fiscal stimulus and fractional reserve lending are much more powerful growth factors than household savings or even household debt
Last week saw the publication of a fascinating working paper by the BIS – The real effects of household debt in the short and long run –the conclusions of the authors were most illuminating, here is the abstract:-
Household debt levels relative to GDP have risen rapidly in many countries over the past decade. We investigate the macroeconomic impact of such increases by employing a novel estimation technique proposed by Chudik et al (2016), which tackles the problem of endogeneity present in traditional regressions. Using data on 54 economies over 1990‒2015, we show that household debt boosts consumption and GDP growth in the short run, mostly within one year. By contrast, a 1 percentage point increase in the household debt-to-GDP ratio tends to lower growth in the long run by 0.1 percentage point. Our results suggest that the negative long-run effects on consumption tend to intensify as the household debt-to-GDP ratio exceeds 60%. For GDP growth, that intensification seems to occur when the ratio exceeds 80%. Finally, we find that the degree of legal protection of creditors is able to account for the cross-country variation in the long-run impact.
The chart below shows the growing divergence between the household debt of developed and emerging market economies:-
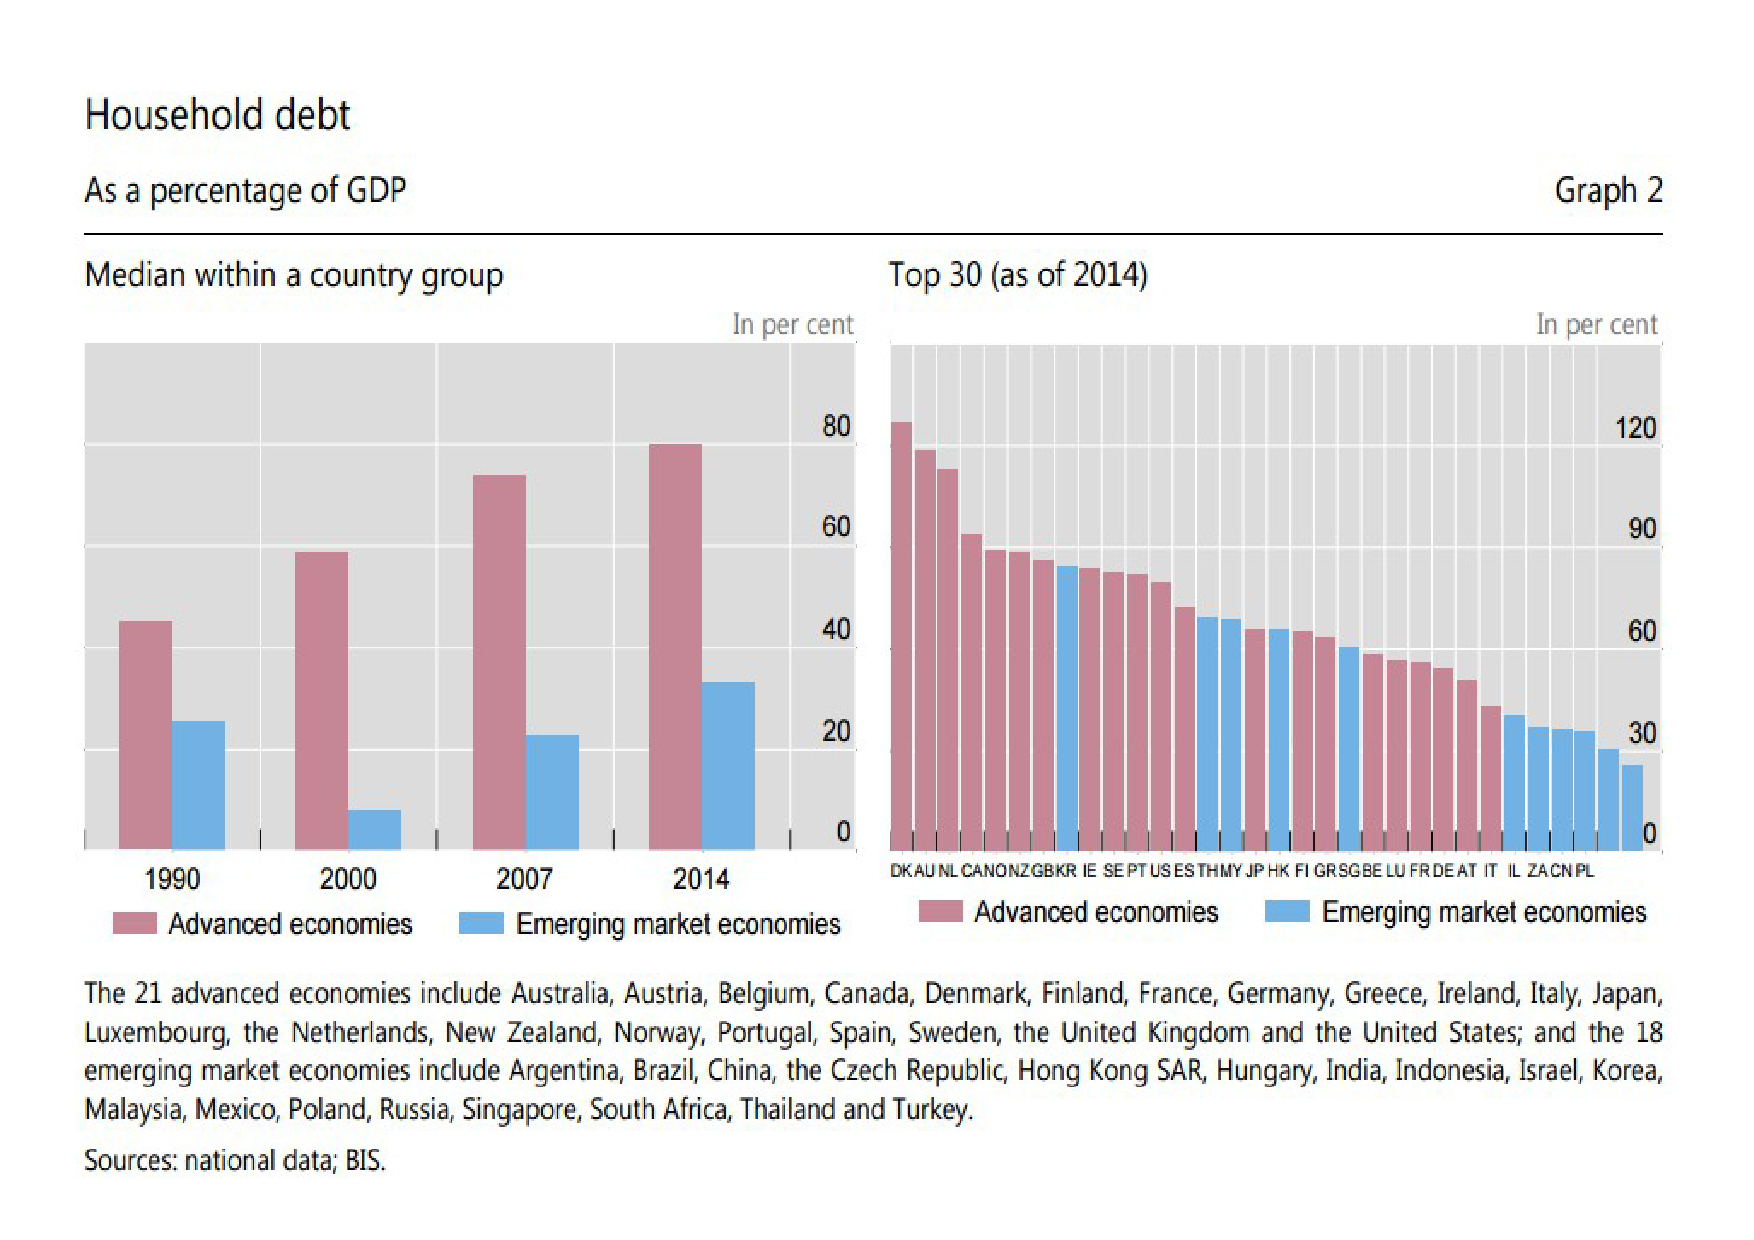
Source: BIS
Of the emerging markets, South Korea has the highest household debt ratio, followed by Thailand, Malaysia and Hong Kong: all have ratios above 60%. Singapore is on the cusp of this watershed, whilst all the remaining emerging economies boast lower ratios.
Part of the reason for lower household debt in emerging economies is the collective market memory of the Asian financial crisis of 1997. Another factor is the higher savings rate among many emerging economies. The table below is incomplete, the data has been gathered from multiple sources and over differing time periods, but it is still quite instructive. It is ranked by highest household savings rate as a percentage of GDP. On this basis, I remain bullish on the prospects for growth in the Philippines and Indonesia, but also in India and Vietnam, notwithstanding the Indian Government debt to GDP ratio of 69% and Vietnam’s budget deficit of -5.4% of GDP:-
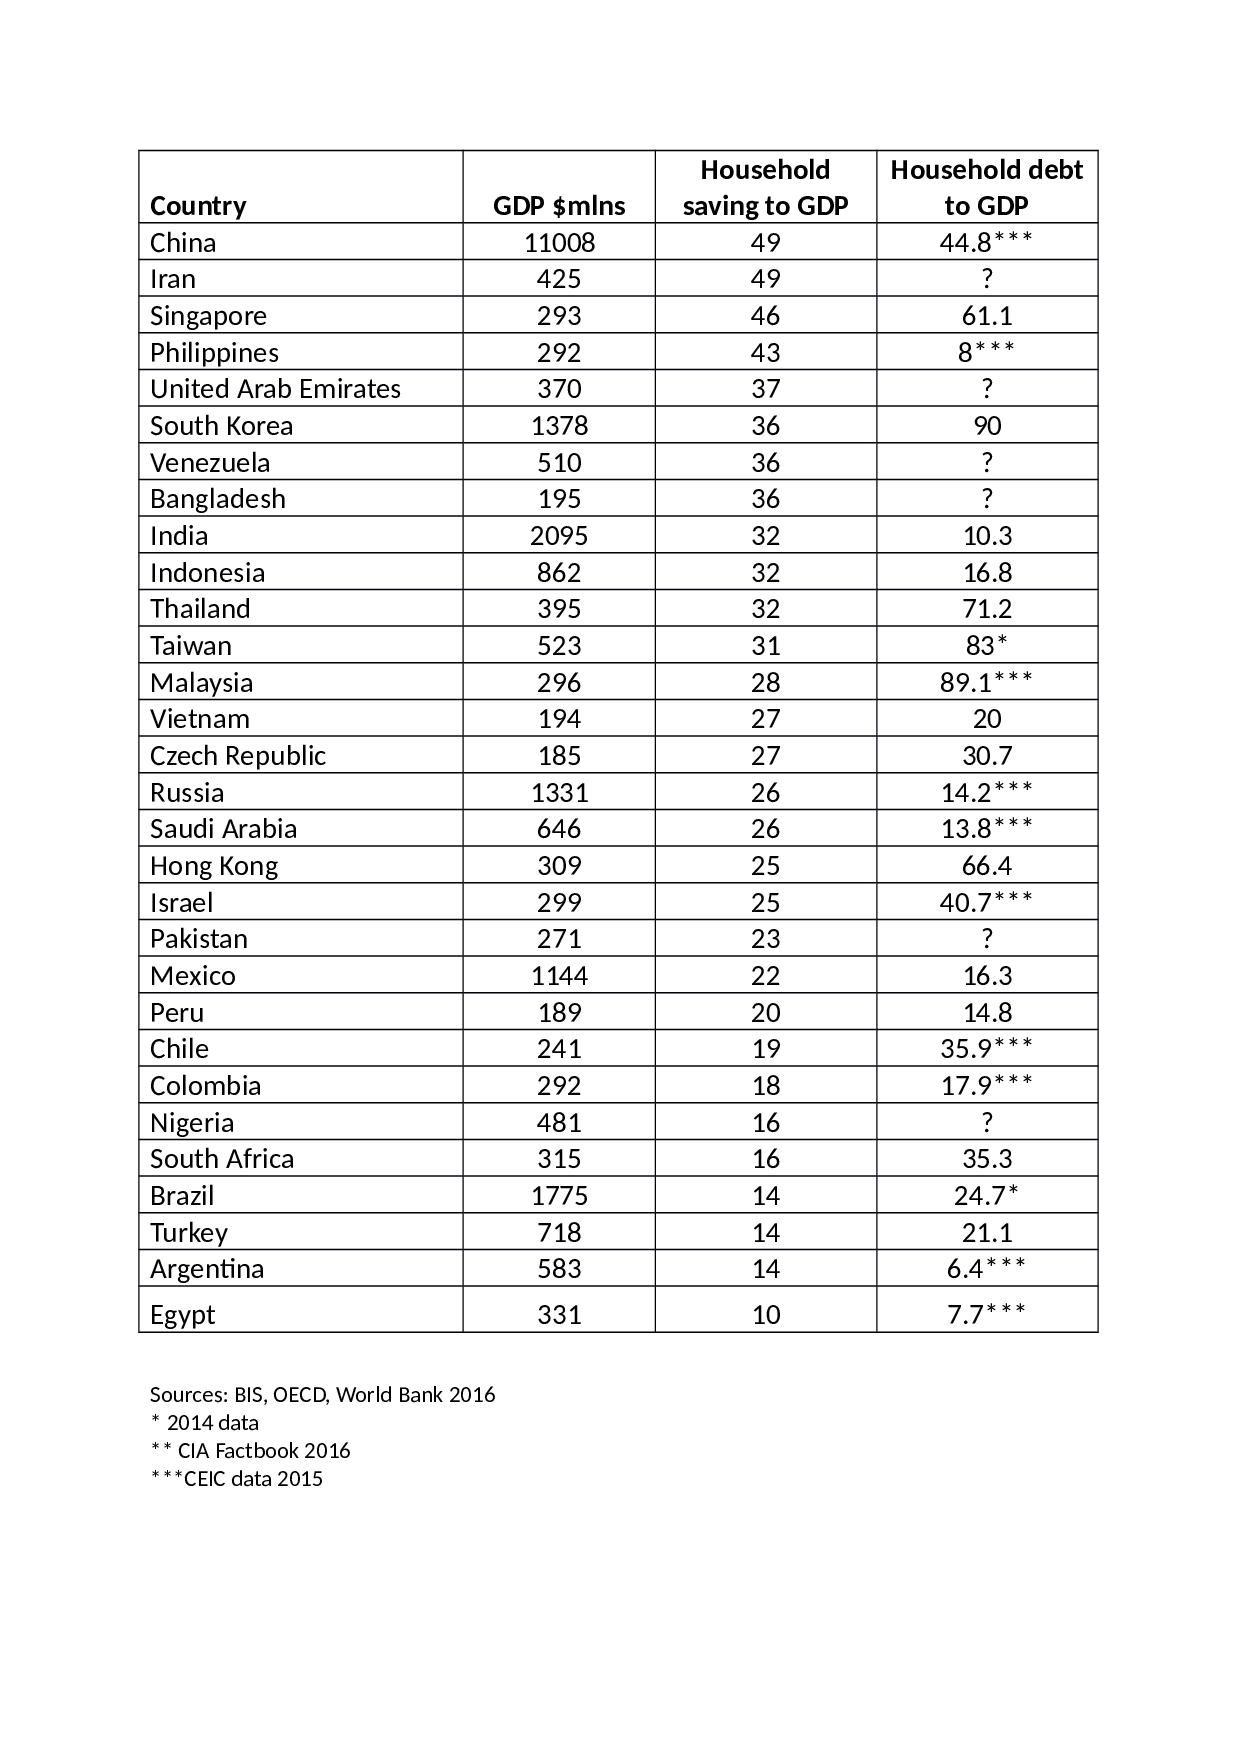
There are other countries who household sector also looks robust: China and Russia, are of note.
Last month I wrote about The Risks and Rewards of Asian Real Estate. This BIS report offers an additional guide to valuation. It helps in the assessment of which emerging markets are more likely to weather the impact of de-globalising headwinds. Policy reversals, such as the scrapping of the TPP trade deal, and other developments connected to Trump’s “America First” initiative, spring to mind.
Savings and Investment
When attempting to forecast economic growth, household debt is one factor, but, according to the economics textbooks, household savings are another. Intuitively savings should support investment, however, in a recent article for Evonomics – Does Saving Cause Lending Cause Investment? (No.) – Steve Roth shows clear empirical evidence that a higher savings rate does not lead to a higher rate of investment. Here is a chart from the St Louis Federal Reserve which supports Roth’s assertions:-

Source: St Louis Federal Reserve Bank
Personal savings represents a small fraction of GDP especially when compared to lending and investment. Roth goes on to analyse the correlations:-

His assessment is as follows:-
Of course, correlation doesn’t demonstrate causation. But lack of correlation, and especially negative correlation, does much to disprove causation. What kind of disproofs do we see here?
Personal saving and commercial lending seem to be lightly correlated. The correlation declines over the course of a year, but then increases two or three years out. It’s an odd pattern, with a lot of possible causal stories that might explain it.
Personal saving and private investment (including both residential and business investment) are very weakly correlated, and what correlation there is is mostly negative. More saving correlates with less investment.
Commercial lending has medium-strong correlation with private investment in the short term, declining rapidly over time. This is not terribly surprising. But it has nothing to do with private saving.
Perhaps the most telling result here: Personal saving has a significant and quite consistent negative correlation with business investment. Again: more saving, less investment. This directly contradicts what you learned in Econ 101.
The last line — commercial lending versus business investment — is most interesting compared to line 3 (CommLending vs PrivInv). Changes in commercial lending seem to have their strongest short-term effects on residential investment, not business investment. But its effect on business investment seems more consistent and longer-term.
This is a fascinating insight, however, there are international factors at work here. This data looks at the US, but the US is a far from closed economy; the current account deficit tells you that. Setting aside cross border capital flows there are even larger forces to consider.
Firstly, in general, when an economy slows, its government increases fiscal spending and its central bank reduces interest rates. Secondly, when short term interest rates fall, banks are incentivised to borrow short and lend long. They achieve this using a fraction of their own capital, lending depositors’ money at longer maturity and profiting from the interest rate differential.
Once fiscal stimulus has run its course and banks have leveraged their reserves to the maximum, the importance of household savings should, in theory, become more pronounced, but if interest rates are low investors are likely to defer investment. If government fiscal pump-priming has failed to deliver an economic recovery, investors are likely to be dissuaded from investing. Despite Roth’s empirical evidence to the contrary, I do not believe that the household savings rate is an unimportant measure to consider when forecasting economic growth, merely that it is overshadowed by other factors.
Conclusion
Household savings may have little impact on GDP growth but Household debt does. In the UK the savings Ratio was 6.6%, whilst the Household debt to income ratio was 152% at the end of 2015. By comparison, at the end of 2014 the US the savings ratio was 5% and household debt to income a more modest 113%. The ratio of the ratios is broadly similar at around 23 times.
With interest rates still close to the lowest levels in centuries and real interest rates, even lower, debt, rather than savings, is likely to be the principal driver of investment. That investment is likely to be channelled towards assets which can be collateralised, real estate being an obvious candidate.
I began this letter with a quote from Hamlet. I wonder what advice Polonius would give his son today? The incentive to borrow has seldom been more pronounced.